


The short answer
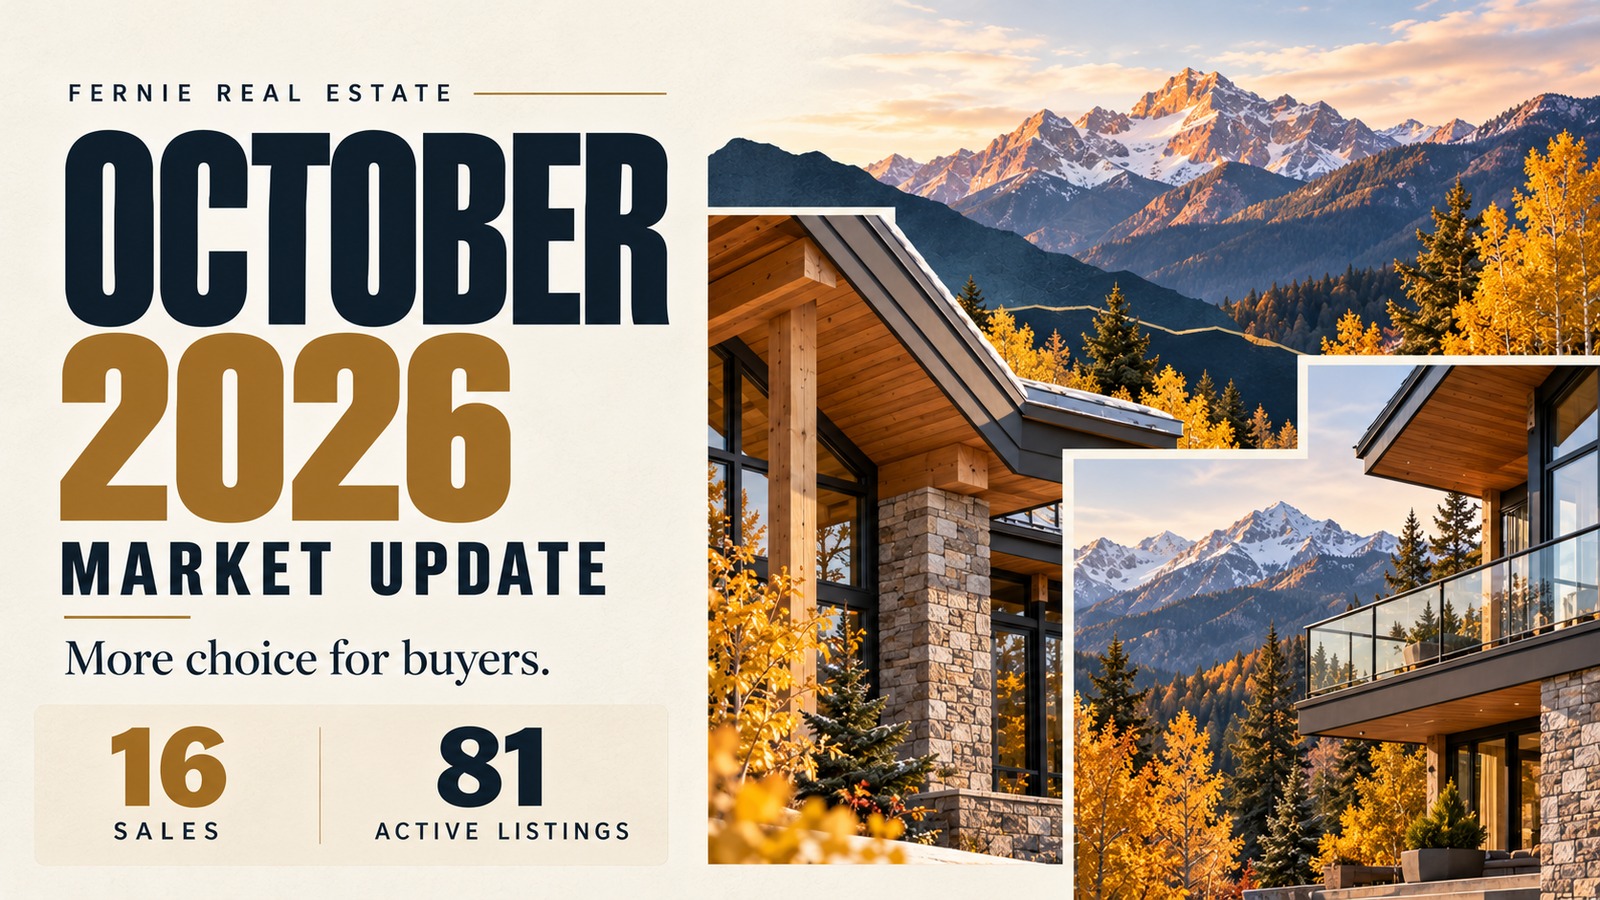
Fernie’s average sale price rose to $876,613 in October 2026, up 8.26% from a year earlier. Sales fell from 21 to 16, while active listings increased from 70 to 81. Buyers had more choice, but the higher monthly average does not mean every property gained eight percent in value. Sellers need to price against relevant competing homes, and buyers should negotiate from comparable sales rather than assume a standard discount.
Prices up. Sales down. More properties to choose from. Those figures can all be true at the same time, particularly in a small market like Fernie.
My take from this month’s report is straightforward: buyers have more options, and sellers still need to give them a reason to choose their property. A ski condo, a family home in the Annex and a rural acreage need different comparisons.
In this report
This report covers residential property in Fernie, the Ski Hill Area, West Fernie and West/East of Fernie. Figures are from the October market summary produced for Phil Gadd on November 1, 2026, using Association of Interior REALTORS® data.
Fernie real estate market at a glance
| Market measure | October 2025 | October 2026 | Change |
|---|---|---|---|
| Sold listings | 21 | 16 | −23.81% |
| New listings | 18 | 25 | +38.89% |
| Average list price | $860,228 | $926,512 | +7.71% |
| Average sale price | $809,735 | $876,613 | +8.26% |
| Sale-to-list ratio | 94.49% | 95.65% | +1.16 points |
| Average days on market | 98.29 | 85.06 | −13.45% |
| Active inventory | 70 | 81 | +15.71% |
| Months of inventory | 4.94 | 5.93 | +19.95% |
| Pending listings | 17 | 9 | −47.06% |
Source: October 2026 Market Summary, produced November 1, 2026. Percentage-point changes are used for the sale-to-list ratio. Other changes are relative percentage changes as printed in the source report.
Why a higher average does not mean every home gained value
The average sale price is the total value of recorded sales divided by the number of sales. With sixteen transactions in October, a few higher-priced properties can have a substantial effect on the result.
That makes $876,613 useful context, but it is not a valuation of your home. The eight-percent increase describes the average of the properties that sold, rather than the price change of a fixed group of identical homes.
Before using that headline to set an asking price or make an offer, compare properties with similar locations, condition, size and use. A resort condo and a detached home in town solve different needs for their buyers.
What the year-to-date figures tell us
Through October, the average sale price was $833,278, compared with $853,784 over the same period in 2025. That is a decline of 2.40%, a much quieter result than October’s eight-percent monthly increase might suggest.
The report records 143 year-to-date sales, compared with 145 a year earlier, a decline of 1.38%. New listings totalled 228, up from 222. The year-to-date average list price was $855,195, down 4.26%.
Properties sold during the first ten months of 2026 averaged 59 days on market, down from 78.80 days in the comparable 2025 period. The year-to-date average sale-to-list ratio was 97.15%, compared with 95.93%. The broader picture is a slightly lower average sale price and similar sales volume, with a shorter average selling time among the properties that sold.
Does almost six months of inventory favour buyers?
Fernie finished October with 5.93 months of inventory, compared with 4.94 a year earlier. That gives buyers more breathing room, but it does not establish that every part of Fernie is a buyer’s market.
Months of inventory estimates how long the available supply would take to sell at the recent sales pace, assuming no new listings. This report uses the previous twelve months’ sales pace, shown as approximately fourteen sales per month. It is not calculated from October’s sixteen sales alone.
October’s 81 active listings give buyers more options than the 70 reported a year earlier. However, the number that fits your budget, property type and intended use may be much smaller.
My recommendation is to build a shortlist by use first. For a ski property, check storage, parking, strata costs and any rental permissions you need. For a year-round family home, consider the daily routine, winter access and usable living space. Then compare the relevant sales.
How much negotiating room is there?
October’s average sale-to-list ratio was 95.65%, compared with 94.49% a year earlier. That is an increase of 1.16 percentage points. It is an indicator of where successful transactions landed relative to the asking price used in the report, not a promise that a seller will accept 4.35% less than any asking price.
A realistic offer still needs to reflect condition, comparable sales, competing interest and the seller’s circumstances. Review the listing’s price history as well: the headline ratio alone does not explain any earlier price reductions.
What the median price tells us
Fernie’s year-to-date median sale price through October 2026 was $737,500. The average sale price was $833,278, a difference of $95,778, or roughly $96,000. The median gives us another way to understand the properties that are selling.
The median is the middle sale price when transactions are arranged from lowest to highest. The average adds up all sale prices and divides by the number of sales. Very expensive transactions can pull the average upward more directly than they affect the median.
That does not make the median the value of a typical detached home, ski condo or acreage. It still reflects the mix of properties sold. For your next move, use both figures as context, then focus on recent sales of the type of property you actually want to buy or sell.
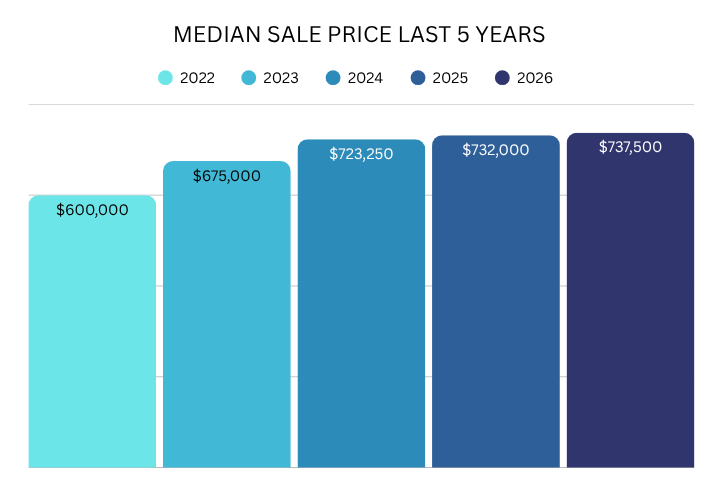
Source: Phil Gadd’s supplied five-year median sale-price chart. The 2026 figure is year to date through October. Earlier bars are shown as supplied; their reporting cutoffs are not specified on the chart, so they are not presented as like-for-like January-to-October comparisons.
What Fernie sellers should do heading into winter
Price against the properties buyers will compare
With more active listings than last October, buyers have more opportunities to compare value. Use recent relevant sales alongside the competition available now. The town-wide average is a starting point for a conversation, not a pricing formula.
Make winter living easy to understand
Keep access clear and safe, brighten the rooms and show how the home handles ski gear, wet boots and everyday storage. In Fernie, those practical details deserve as much attention as the view.
Snow can hide parts of a property that buyers need to assess. Keep useful summer photographs and maintenance records available, and be clear about what cannot be inspected properly under winter conditions.
Plan around your own timeline
Properties that sold in October averaged 85.06 days on market, down from 98.29 days a year earlier. That describes those completed sales, not every active listing, and it does not guarantee a sale within three months.
If your next purchase depends on this sale, allow for marketing time, conditions and completion. Review your progress against enquiries, showings and competing listings rather than simply waiting for the market average to pass.
What Fernie buyers should do with the extra choice
Get ready before the right property appears
Have your financing reviewed and understand your budget before making an offer. More inventory can give you time to compare, but it does not mean the property that best fits your needs will remain available.
Compare the cost of ownership
Look beyond the purchase price. Ask about heating, insurance, strata fees where applicable, maintenance and snow clearing. If rental income is part of your plan, verify the property’s permissions and realistic costs before relying on it.
Use the numbers to support a specific offer
Start with comparable sales and the work the property needs. Then consider terms and timing. A well-supported offer is more useful than applying the market’s average discount to every listing.
Frequently asked questions
What was the average sale price in Fernie in October 2026?
The average sale price was $876,613, up 8.26% from October 2025. That reflects the mix of properties sold, not the change in value of every Fernie home.
How many properties sold in Fernie in October?
Sixteen properties sold, compared with twenty-one in October 2025. That is a decrease of 23.81%. The report also records nine pending listings, down from seventeen; pending activity is separate from completed sales.
How many Fernie properties were available?
There were 81 active listings at October 31, compared with 70 a year earlier, an increase of 15.71%. Twenty-five new listings came onto the market during October, up from eighteen.
How long are Fernie properties taking to sell?
Properties sold during October averaged 85.06 days on market. Individual timelines vary, and this figure does not include the eventual selling time of listings that remained unsold.
Is Fernie a buyer’s market?
More active listings and 5.93 months of inventory point to greater choice for buyers. The better answer depends on the supply and demand for your particular property type, location and price range.
How has the Fernie market performed in 2026?
Through October, the average sale price was $833,278, down 2.40% year over year. The report records 143 sales, down from 145, and an average selling time of 59 days, down from 78.80 days.
What is the median sale price in Fernie?
The year-to-date median sale price through October 2026 was $737,500, compared with an average of $833,278. The median is the middle recorded sale price, not an estimate of every property’s value.
The bottom line
October’s message is that buyers have more choice while sellers still have opportunities. The increase in the monthly average sale price should not distract either side from comparable sales, current competition and the condition of the property.
If you are considering a move, let’s look at the part of the Fernie market that matters to you. Call or text me at 778-745-0347 or email phil@philgadd.com. We will work through your property, your budget and your next step.
About Phil Gadd
Phil Gadd leads First Tracks Real Estate Group, brokered by eXp Realty in Fernie, BC. He has lived in Fernie for 17 years and sold real estate in the Elk Valley for eight years. He hosts the Property Mindset Podcast, home of the Fernie Real Estate Market Report.
Sources and methodology
Primary statistical source: October 2026 Market Summary, produced for Phil Gadd on November 1, 2026, by RE STATS Inc., using data compiled from the Association of Interior REALTORS®. Supplied file: market_stats_Oct26_Fernie.pdf, page labelled 10 of 10. Reviewed November 1, 2026.
Scope: Kootenay Division, residential property, delimited by subareas FE - Fernie; FERU - Ski Hill Area; FERU - West Fernie; and FERU - West/East of Fernie. Inventory is measured at October 31, 2026. Year-to-date figures compare January through October in each year.
Monthly and year-to-date figures, other than the median, are taken from the current market summary. The $737,500 median is supported by Phil Gadd’s supplied five-year and ten-year median charts (5Y_Med.png and 10Y_Med.png). His average-price charts also show $833,278 for 2026. The 2026 figures are year to date through October; the charts do not state the earlier years’ reporting cutoffs. Months of inventory uses the previous twelve months’ sales pace. Pending listings are separate from sold listings. The ratio changes shown in this article are percentage-point differences: 95.65% minus 94.49% equals 1.16 percentage points. The report expresses that change as a 1.23% relative increase.
The source states that information is deemed reliable but not guaranteed and does not reflect all market activity. Monthly averages are sensitive to the number and mix of sales. Days on market describes properties that sold. The supplied summary does not specify whether list prices are original or final asking prices, so this article makes neither assumption. These statistics are not individual property valuations.